ICARIA-MM: SARCLISA + POMALIDOMIDE AND DEXAMETHASONE (Pd)
Subgroup Data for SARCLISA + Pd
Consistent PFS results were seen across subgroups with
SARCLISA + Pd1-3
| Favors | Favors | No. of events/total | |||
|---|---|---|---|---|---|
| Subgroup | SARCLISA + Pd |
Pd | SARCLISA + Pd |
Pd | HR (95% CI) |
| All patients | |||||

|
73/154 | 89/153 | 0.60 (0.44, 0.81) | ||
| Age, years | |||||
| <65 |

|
26/54 | 41/70 | 0.66 (0.40, 1.07) | |
| 65-74 |

|
32/68 | 29/54 | 0.64 (0.39, 1.06) | |
| ≥75 |

|
15/32 | 19/29 | 0.48 (0.24, 0.95) | |
| R-ISS stage at study entry | |||||
| I |

|
13/39 | 17/31 | 0.58 (0.28, 1.21) | |
| II |

|
47/99 | 57/98 | 0.59 (0.40, 0.87) | |
| III |

|
13/16 | 15/24 | 0.61 (0.28, 1.31) | |
| Cytogenetic abnormalitya | |||||
| Standard |

|
50/103 | 48/78 | 0.62 (0.42, 0.93) | |
| At least 1 high-risk cytogenetic abnormality |

|
14/24 | 22/36 | 0.66 (0.33, 1.28) | |
| del(17p) |

|
7/14 | 13/23 | 0.76 (0.30, 1.92) | |
| t(4;14) |

|
8/12 | 9/14 | 0.49 (0.19, 1.31) | |
| gain(1q21) |

|
41/76 | 37/52 | 0.40 (0.25, 0.63) | |
| Renal impairment | |||||
| <60 mL/min/1.73 m2 |

|
30/55 | 29/49 | 0.50 (0.30, 0.85) | |
| ≥60 mL/min/1.73 m2 |

|
36/87 | 55/96 | 0.58 (0.38, 0.88) | |
| Previous lines of therapy | |||||
| 2-3 |

|
44/102 | 57/101 | 0.59 (0.40, 0.88) | |
| >3 |

|
29/52 | 32/52 | 0.59 (0.36, 0.98) | |
| Refractory to a Pl | |||||
| Yes |

|
57/118 | 67/115 | 0.58 (0.41, 0.82) | |
| No |

|
16/36 | 22/38 | 0.67 (0.35, 1.28) | |
| Refractory to lenalidomide | |||||
| Yes |

|
72/144 | 82/140 | 0.59 (0.43, 0.82) | |
| No |

|
1/10 | 7/13 | 0.18 (0.02, 1.49) | |
| Refractory to lenalidomide and a Pl | |||||
| Yes |

|
56/111 | 62/107 | 0.58 (0.40, 0.84) | |
| No |

|
17/43 | 27/46 | 0.60 (0.33, 1.11) | |
| Previous ASCT | |||||
| Yes |

|
40/83 | 55/90 | 0.60 (0.40, 0.90) | |
| No |

|
33/71 | 34/63 | 0.62 (0.38, 1.00) | |


aCytogenetic risk information was missing for 18% of patients in the SARCLISA + Pd arm and 26% of patients in the Pd arm. Of the patients who had high-risk chromosomal abnormalities at study entry, del(17p), t(4;14), and t(14;16) were present in 12%, 8%, and 2% of patients, respectively. High-risk cytogenetic status was defined by the presence of ≥1 of del(17p), t(4;14), or t(14;16), and was considered positive if present in ≥30% of plasma cells for t(4;14) and t(14;16), and in ≥50% of plasma cells for del(17p). Gain(1q21) was considered positive if ≥3 copies of 1q21 were present in ≥30% of analyzed cells.1,3,4
Study limitations
Prespecified subgroup analysis; subgroups were not powered to show differences between treatment arms.
PFS and ORR in the intent-to-treat population4
mPFS: 11.53 months with SARCLISA + Pd (n=154) vs 6.47 months with Pd alone (n=153), HR=0.596 (95% CI: 0.44, 0.81; P=0.0010)
ORR: SARCLISA + Pd, 60.4% (95% CI: 0.52, 0.68); Pd, 35.3% (95% CI: 0.28, 0.43)
ASCT=autologous stem cell transplant; mPFS=median progression-free survival; ORR=overall response rate; PFS=progression-free survival; PI=proteasome inhibitor; R-ISS=Revised International Staging System.
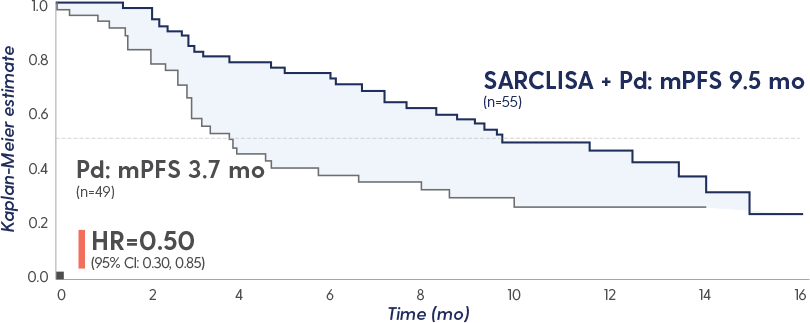
PFS and ORR with SARCLISA + Pd in patients with renal impairment*
PFS in patients with renal impairment5
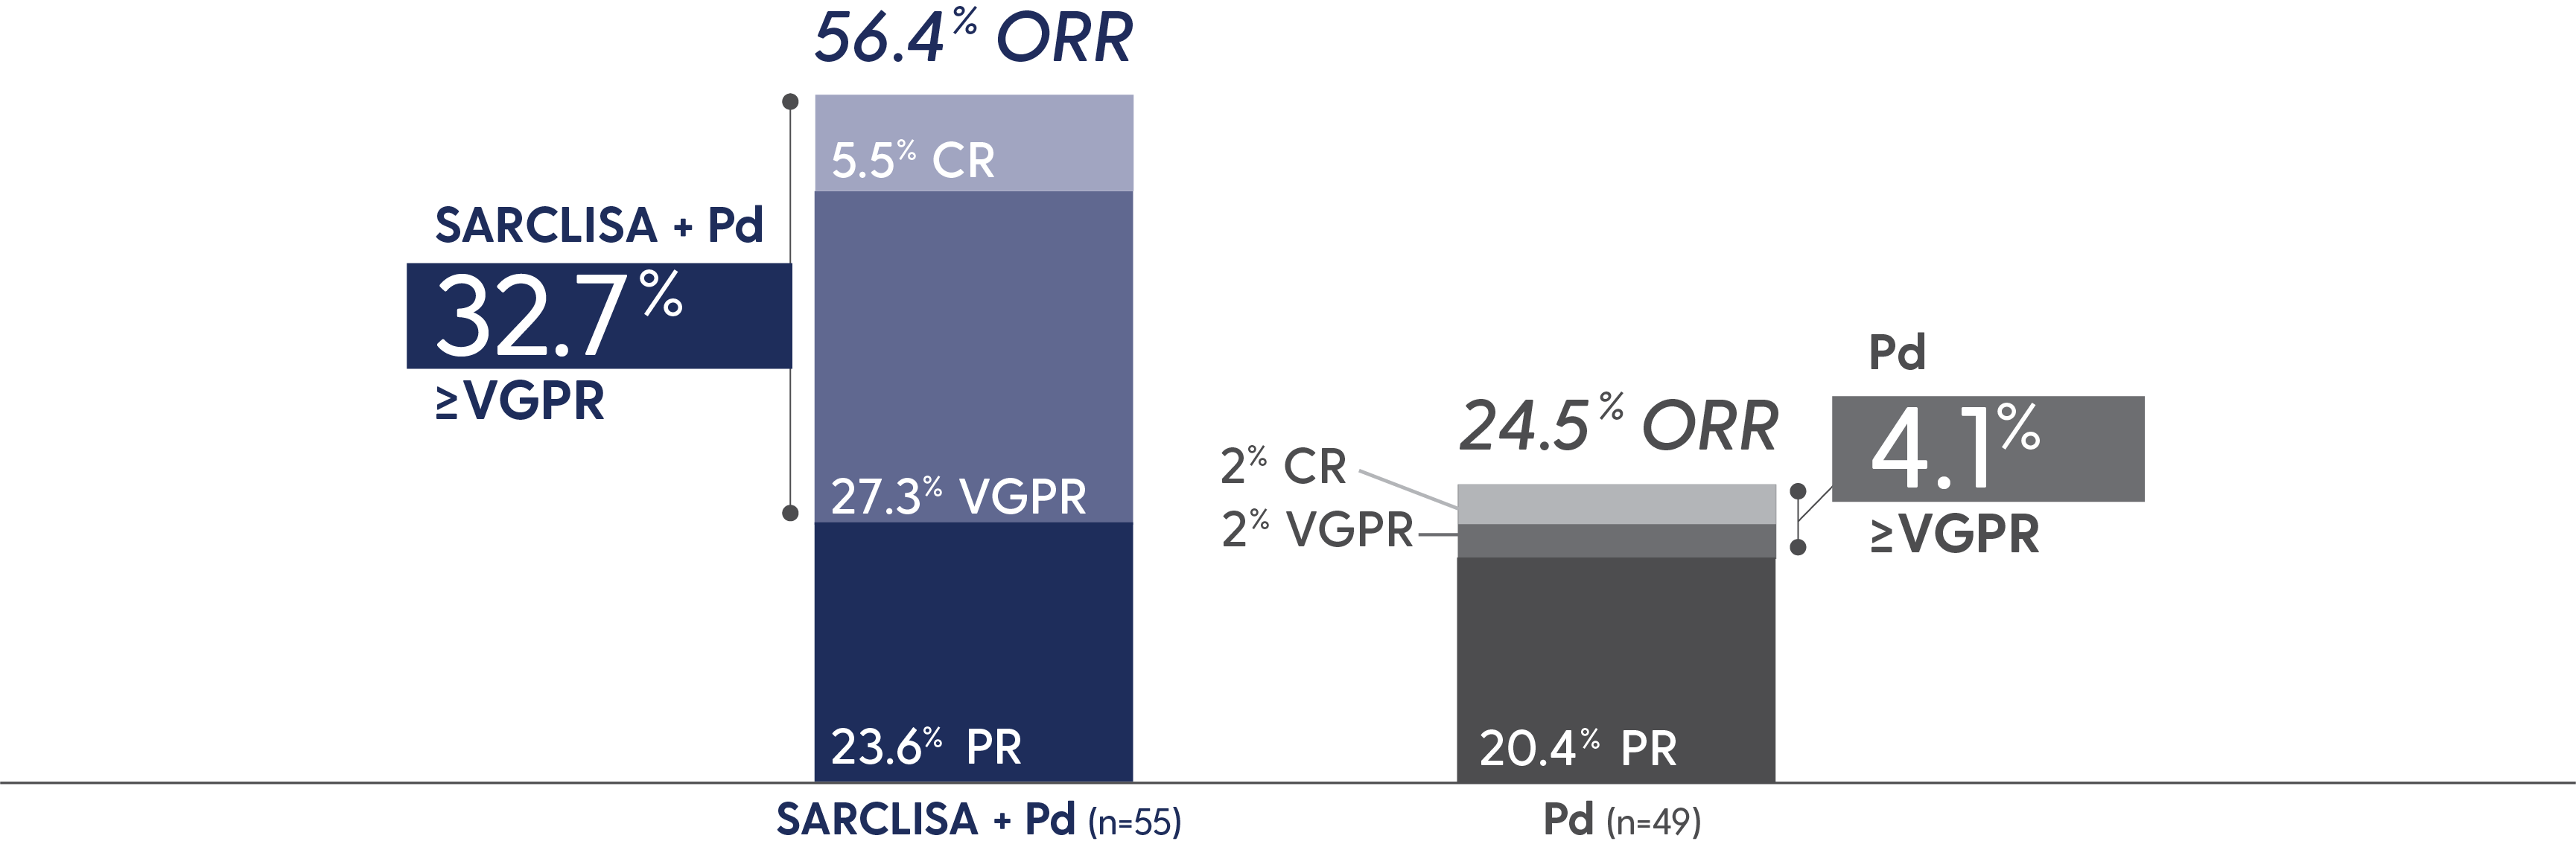
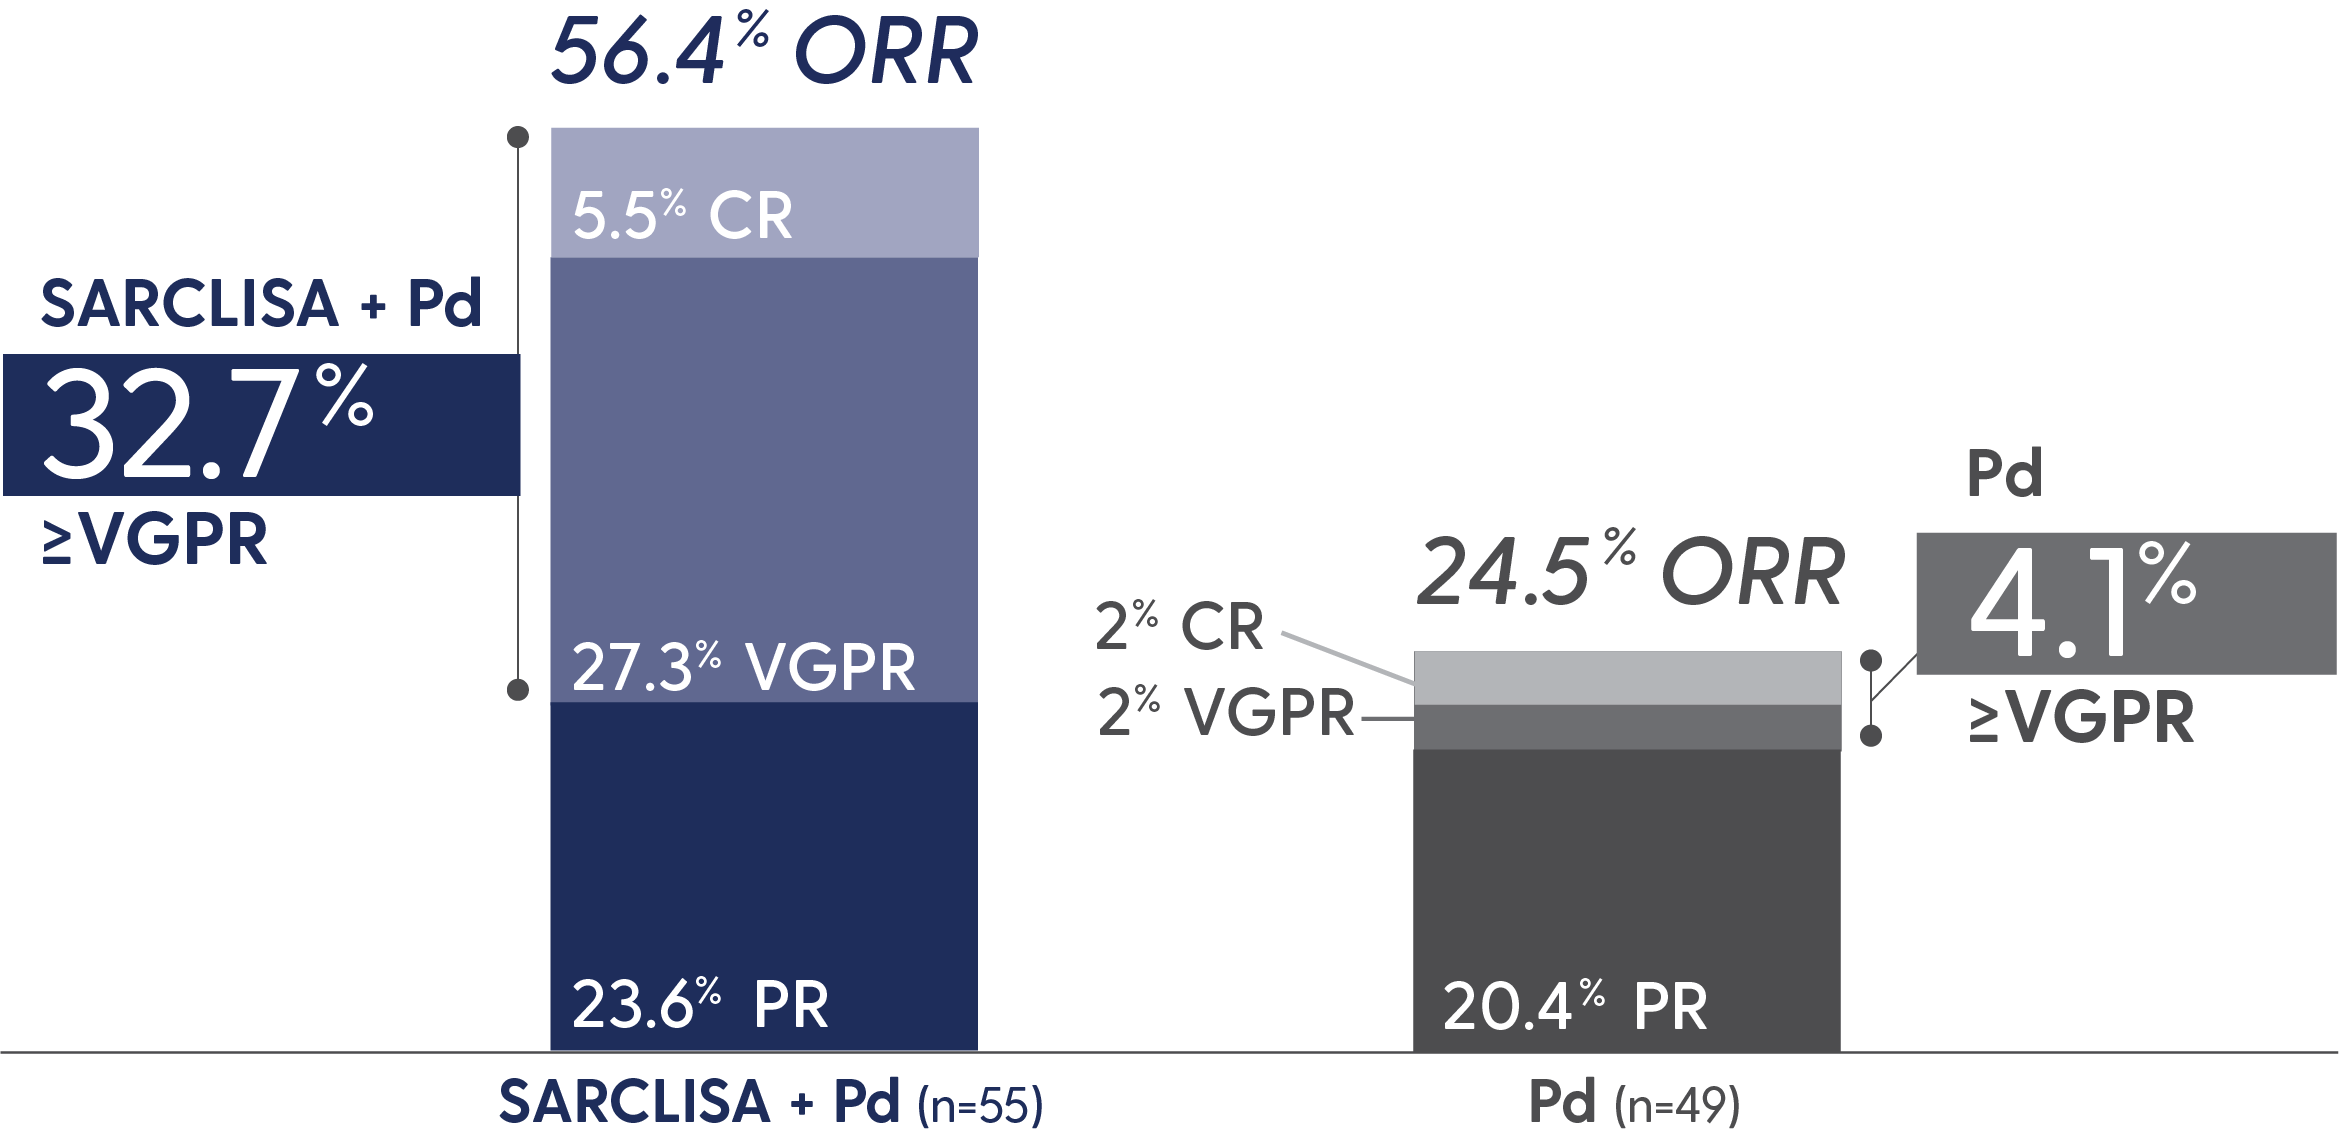
Response rates in patients with renal impairment5
Study limitations
Prespecified subgroup analysis; subgroups were not powered to show differences between treatment arms.
*eGFR <60 mL/min/1.73 m2.4
CR=complete response; eGFR=estimated glomerular filtration rate; PR=partial response; VGPR=very good partial response.
Reduction in the risk of disease progression in patients treated with SARCLISA + Pd vs Pd alone1
min/1.73 m2
Study limitations
Prespecified subgroup analysis; subgroups were not powered to show differences between treatment arms.
†Cytogenetics by central lab; cutoff 50% for del(17p), 30% for t(4;14) and t(14;16).1
Learn about patient types that may be right for treatment
with
sarclisa + Pd